Last updated by: JeetashaArora, Last updated on: 27/09/2024
Teacher Dashboard
Document Creation: 24 September, 2024. Last Edited: 24 September, 2024. Author: Jessica Maugueret
The teacher dashboard is an intuitive interface designed to enhance the teaching experience and monitor student progress effectively. Accessible through a login page after clicking the settings button on the main code playground page, the dashboard consists of four distinct tabs, each serving a unique function.
Figma Prototyping
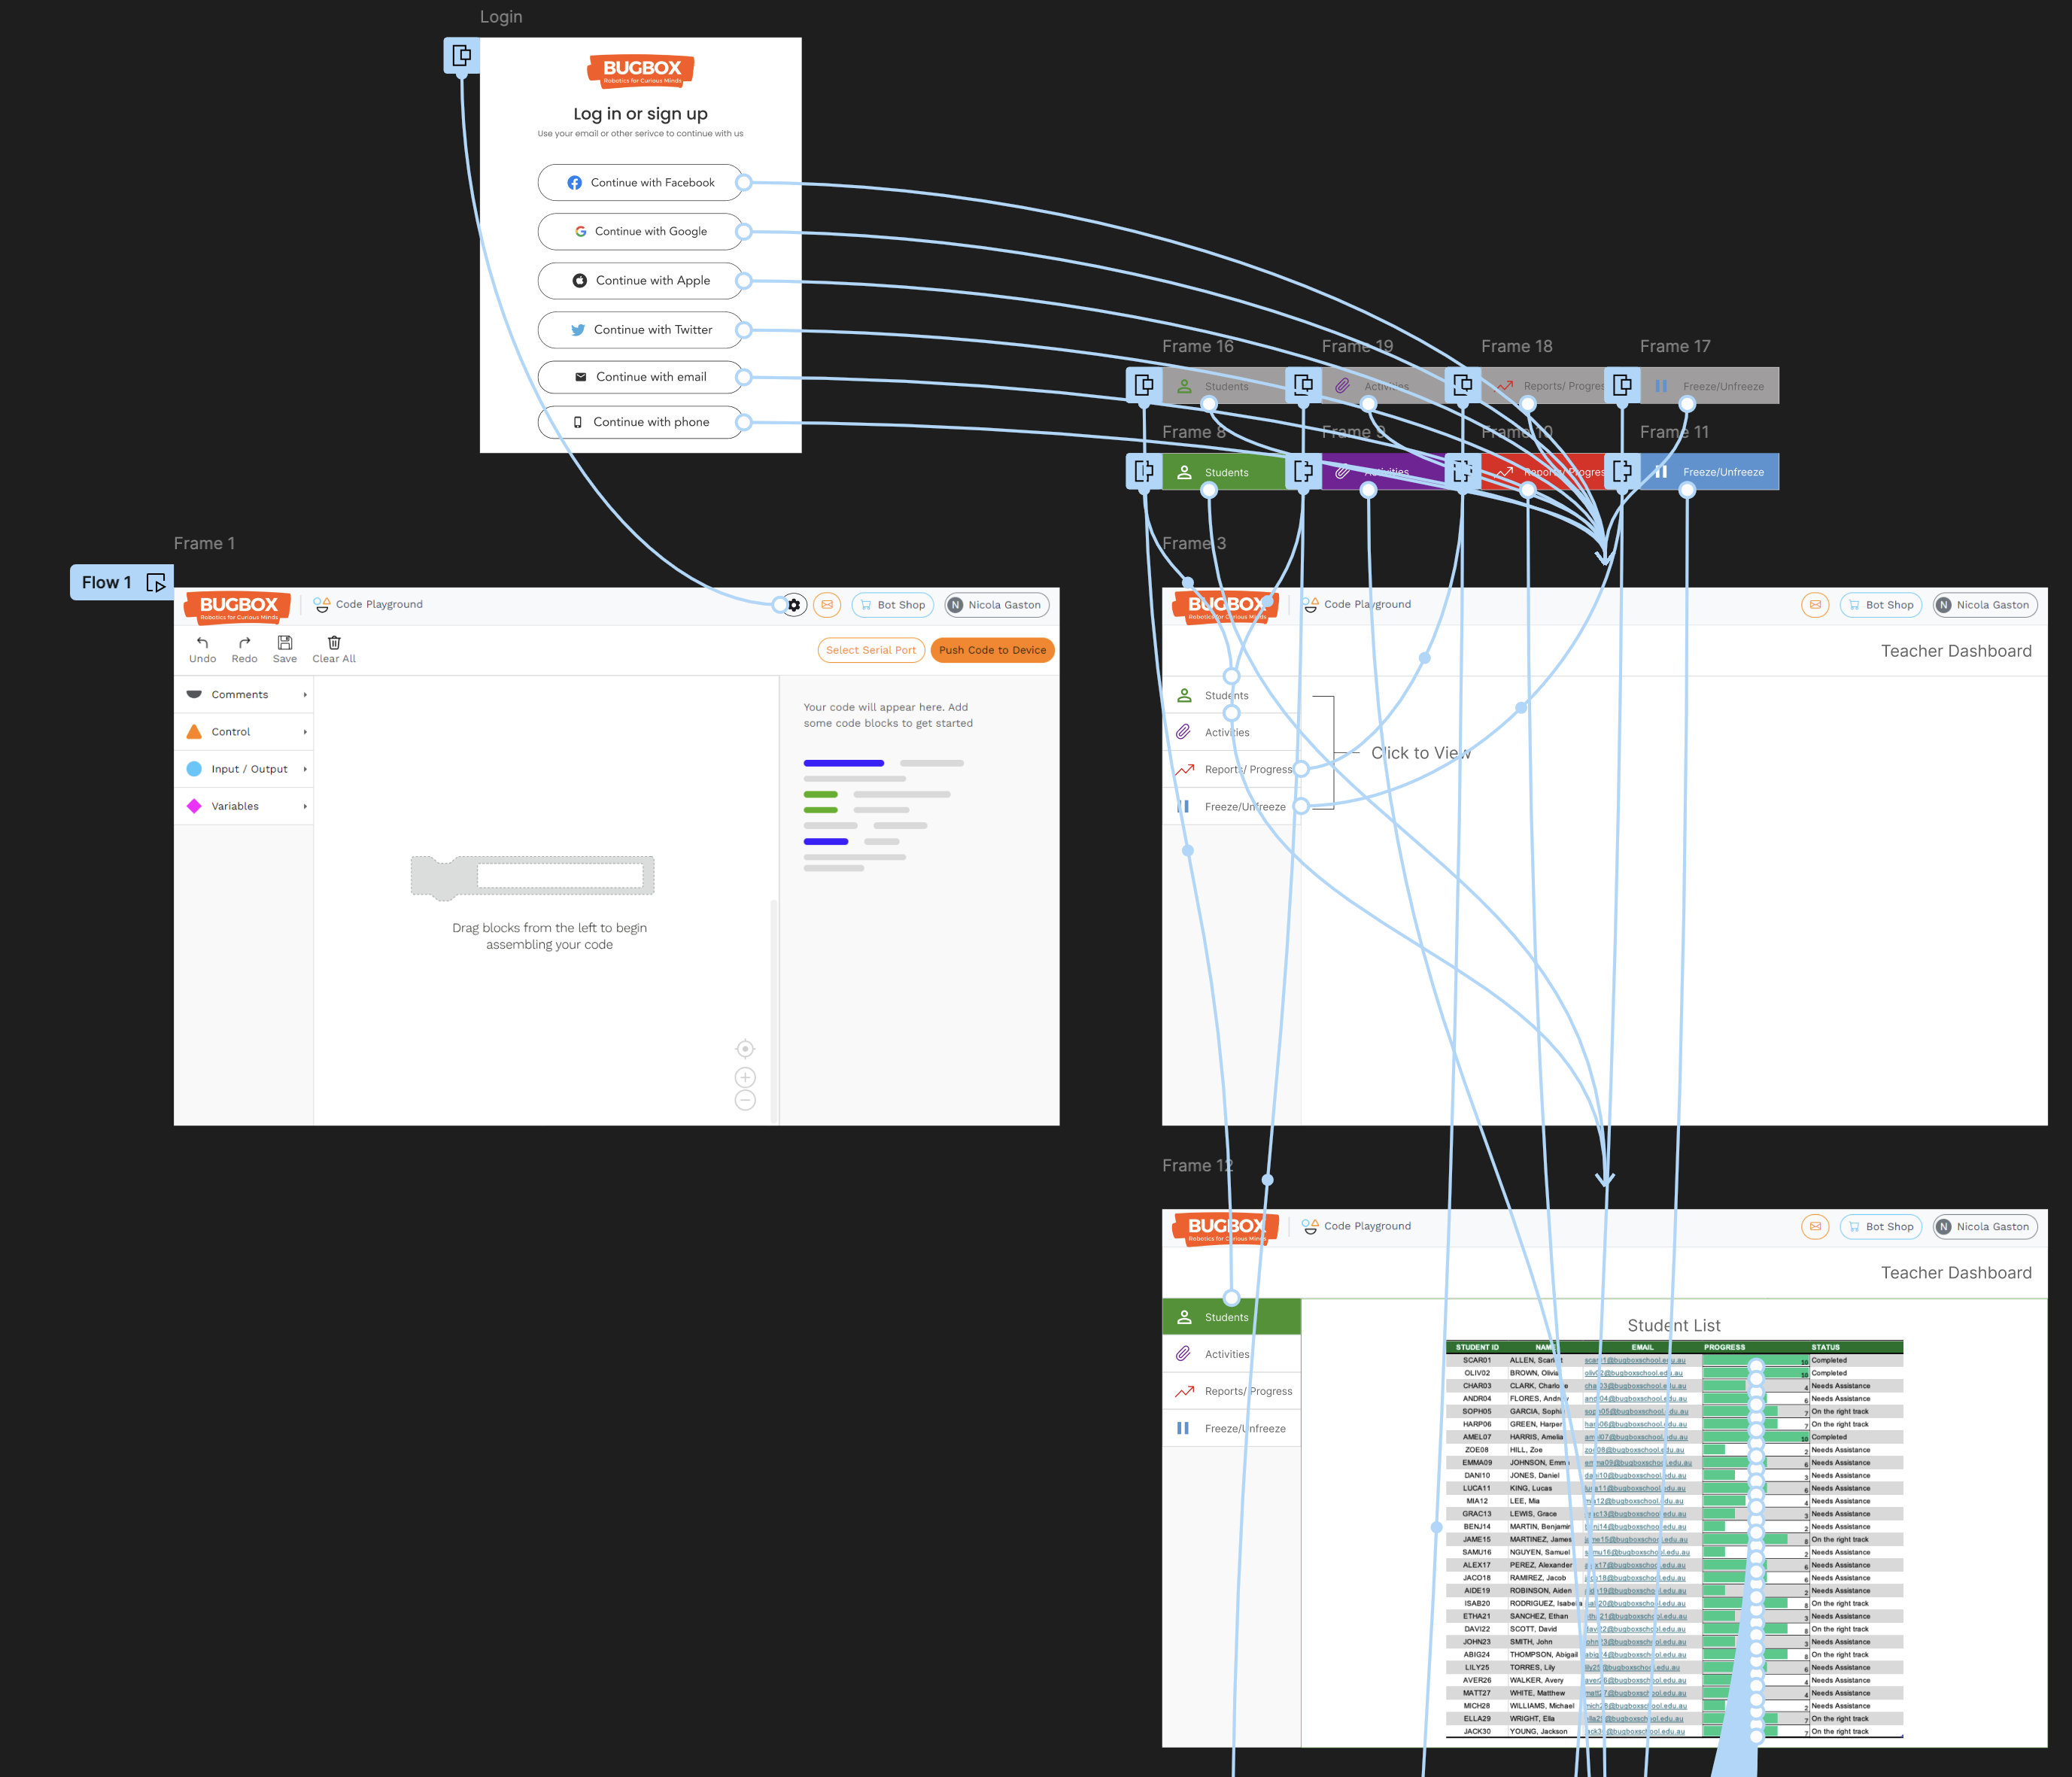
You can explore the development of the dashboard through the following Figma links:
To trial the teacher dashboard, click on the Prototype Mode!!
If you don't know where to click, click on the page randomly and options will pop up for you.
Navigating the Prototype
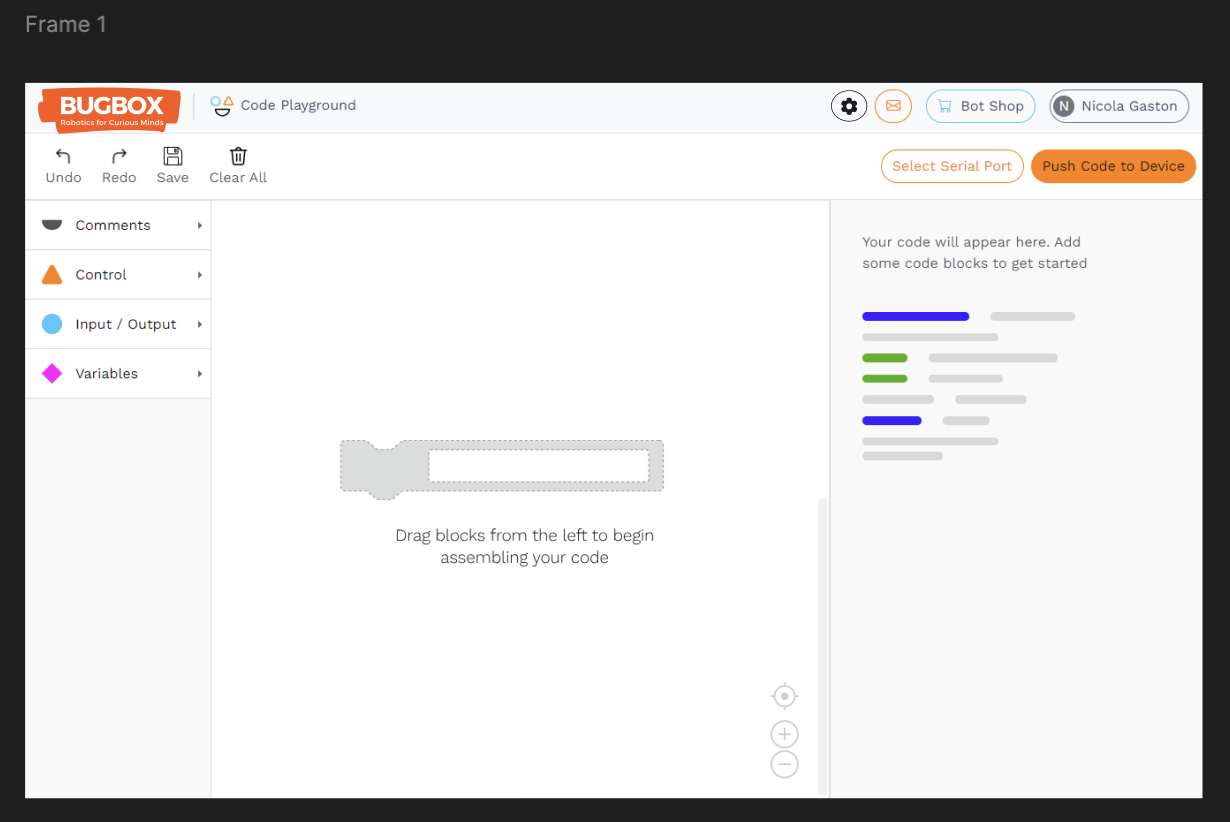
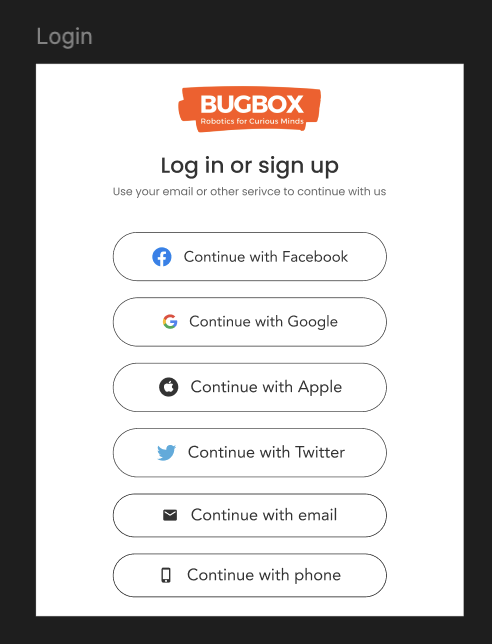
To navigate the prototype, teachers can click on the settings button located on the main code playground page. This action opens the login page, where they can enter their credentials to access the dashboard.
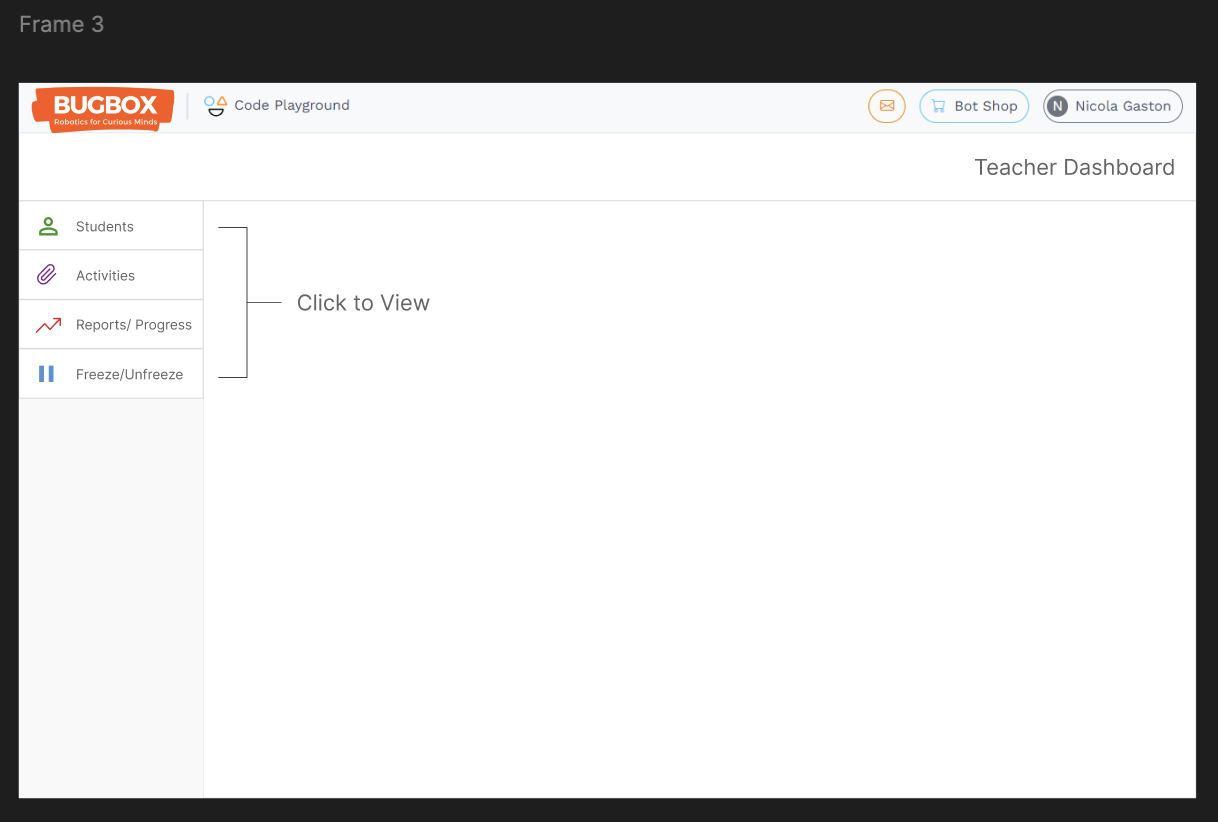
0: Main Page
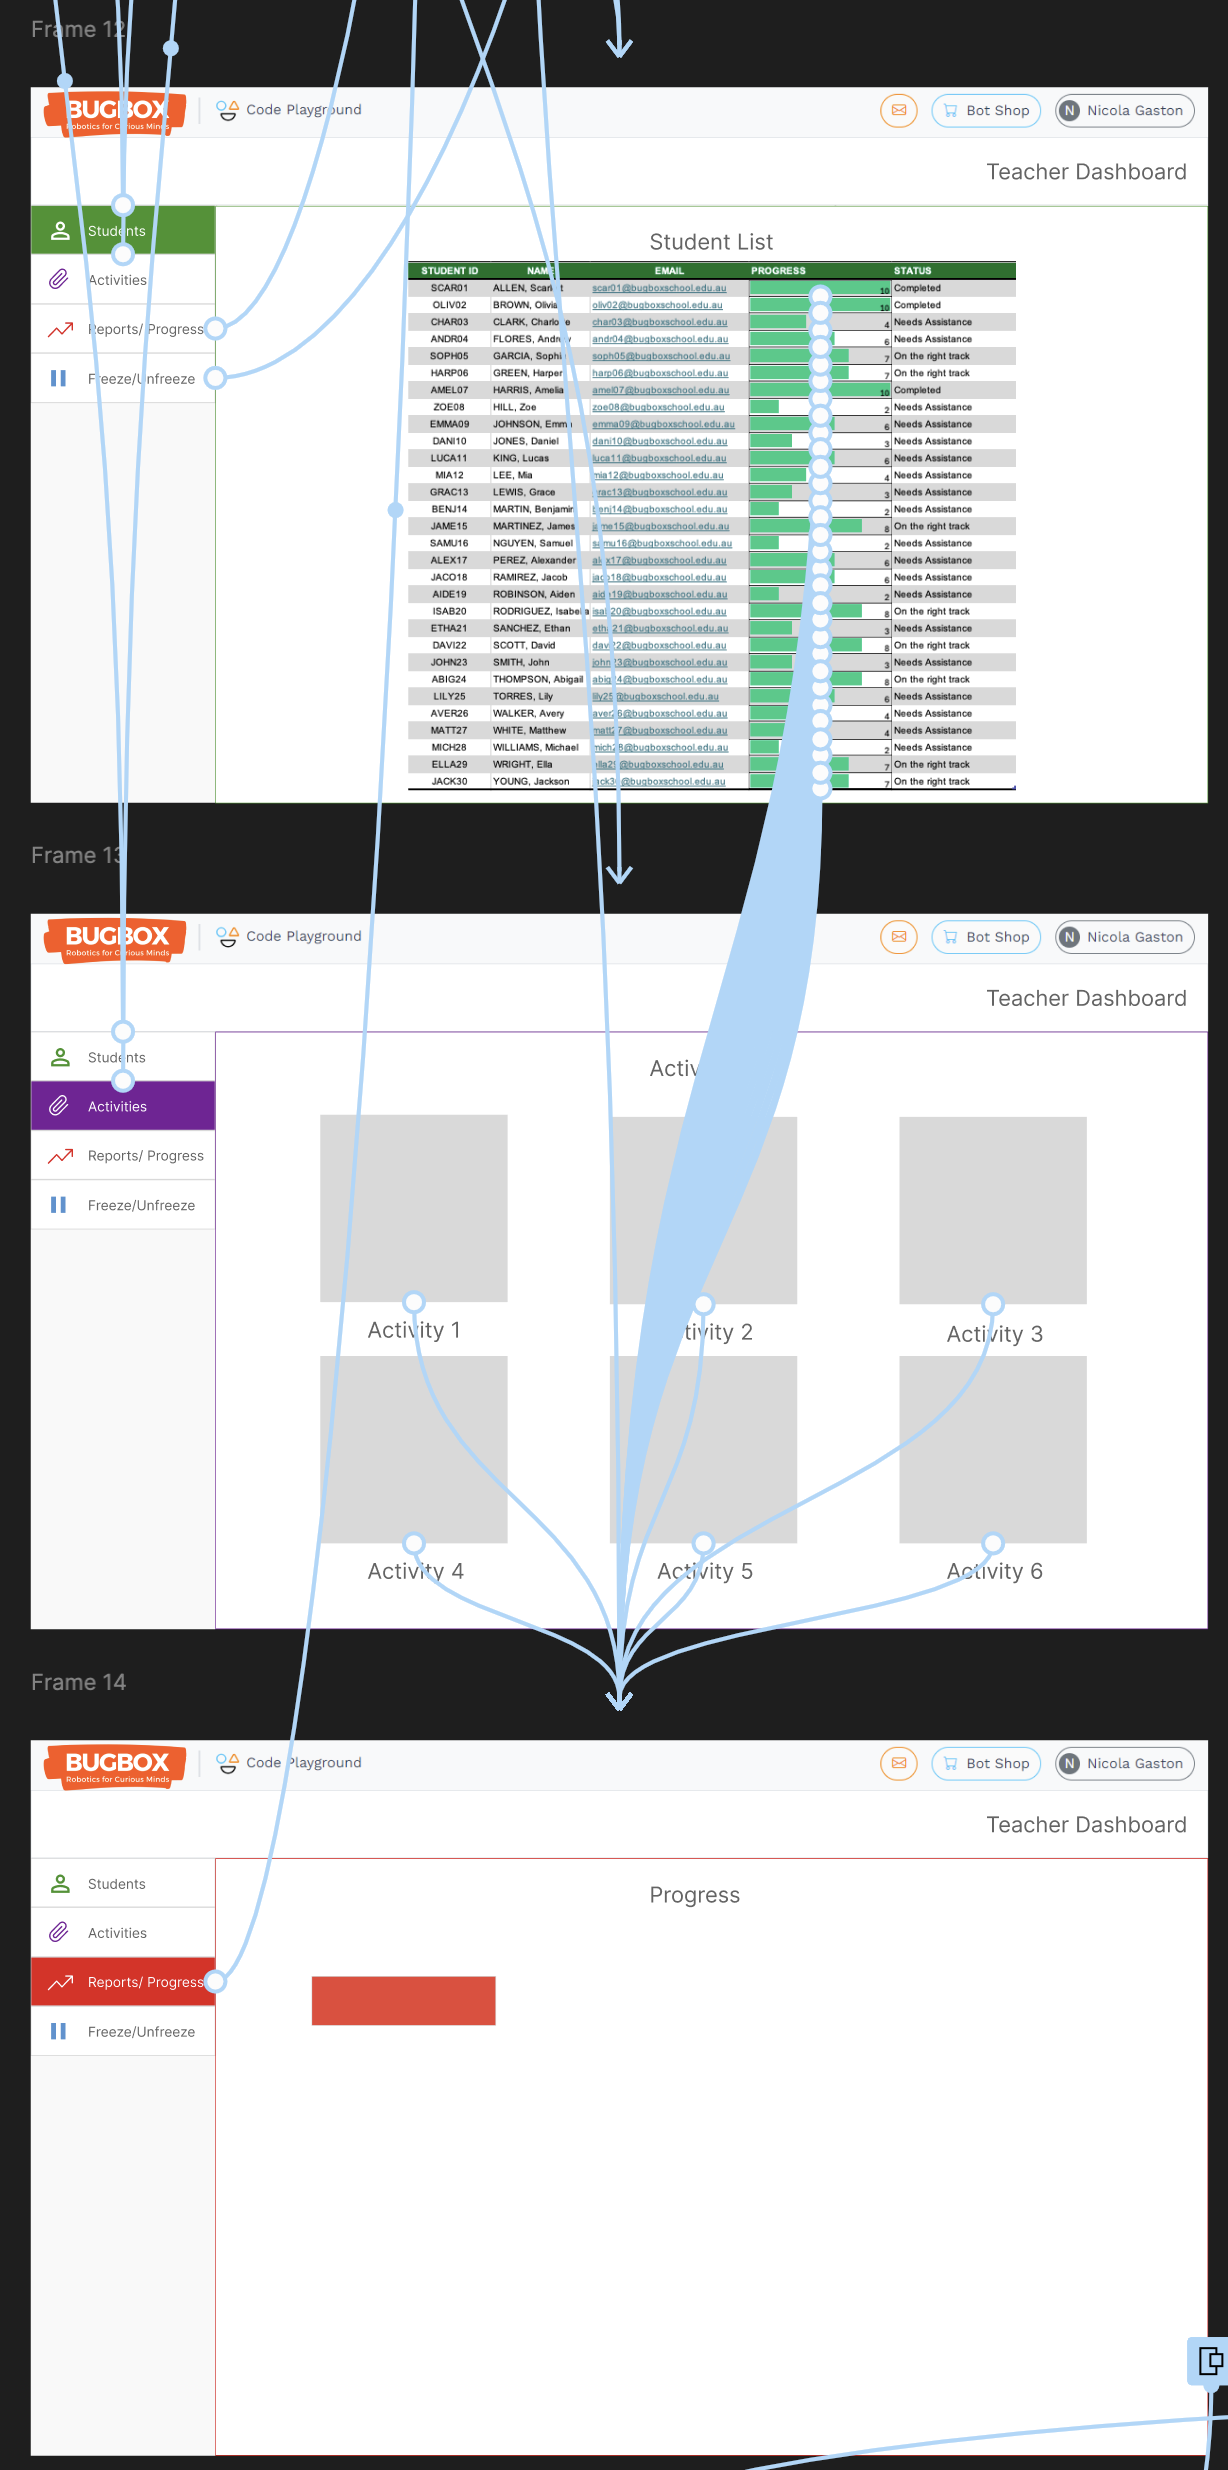
Once logged in, teachers can easily switch between tabs by clicking on the tab titles on the left side of the screen. Each tab is color-coded, providing visual cues for easier navigation. As teachers hover over the tabs, they will change to their respective colors, enhancing the user experience and making it clear which section they are in.
1: Student Tab
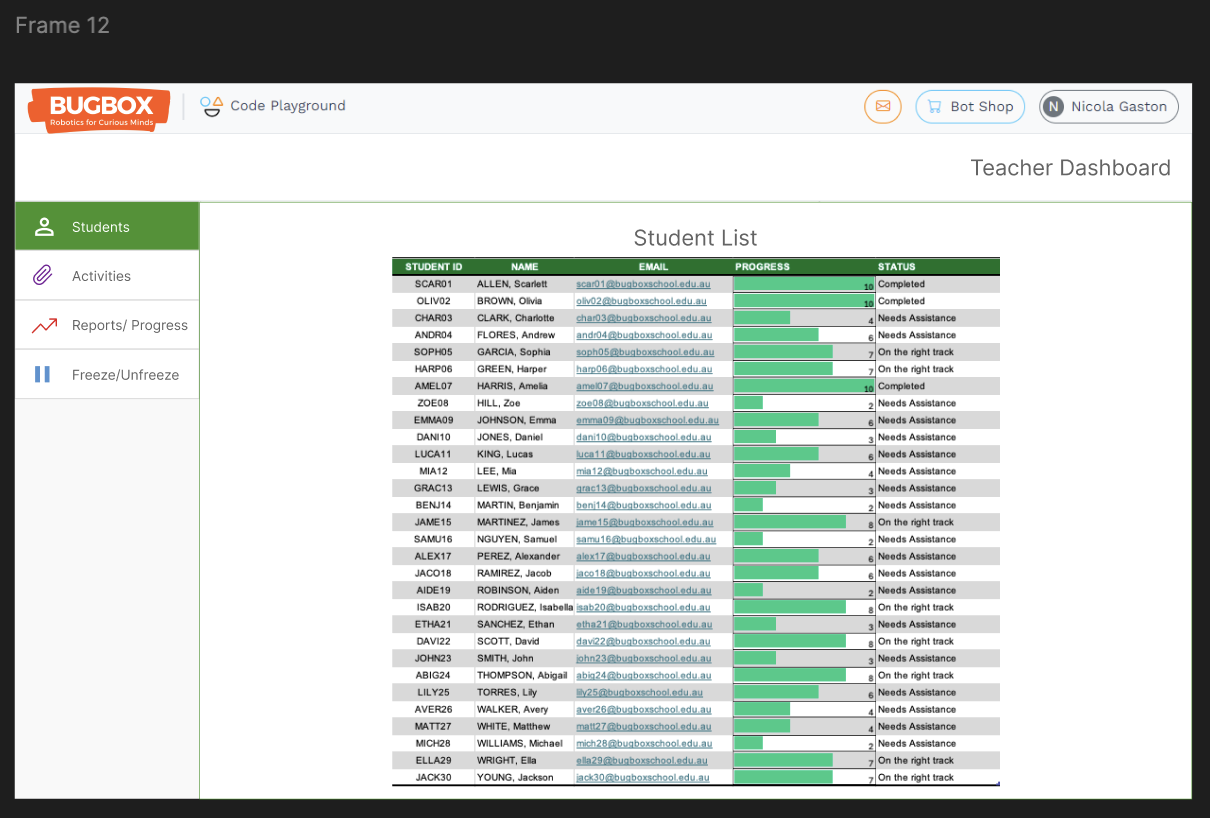
The Student Tab provides a comprehensive list of students, showcasing their individual information and progress. Teachers can easily view and track each student's learning journey. By clicking on any of the progress bars next to a student’s name, teachers are directed to Tab 3, where they can delve deeper into specific student metrics and performance details.
2: Activities Tab
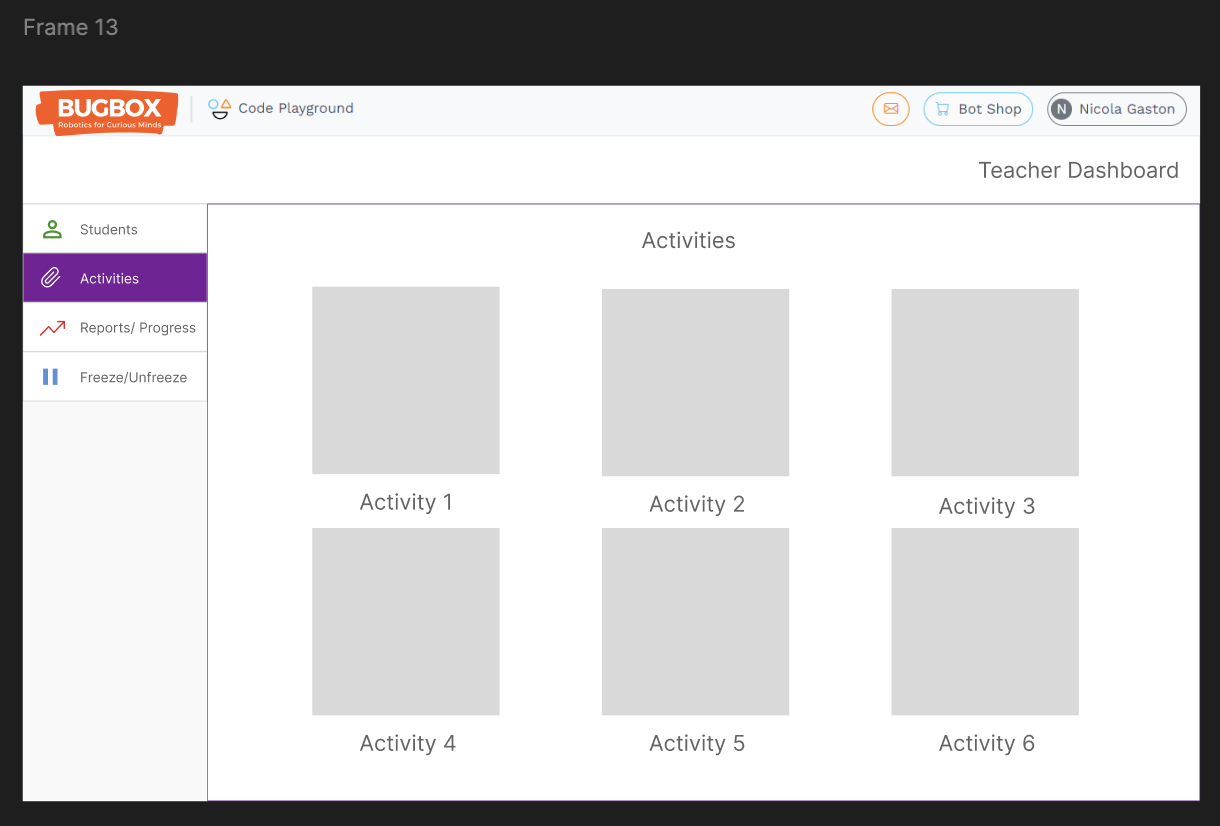
In the Activities Page, teachers have the ability to assign tasks and activities to their students. This feature allows for customized learning experiences, enabling educators to tailor assignments based on the needs and progress of their students. Teachers can easily manage and distribute tasks, ensuring that every student remains engaged and challenged.
3: Report Tab
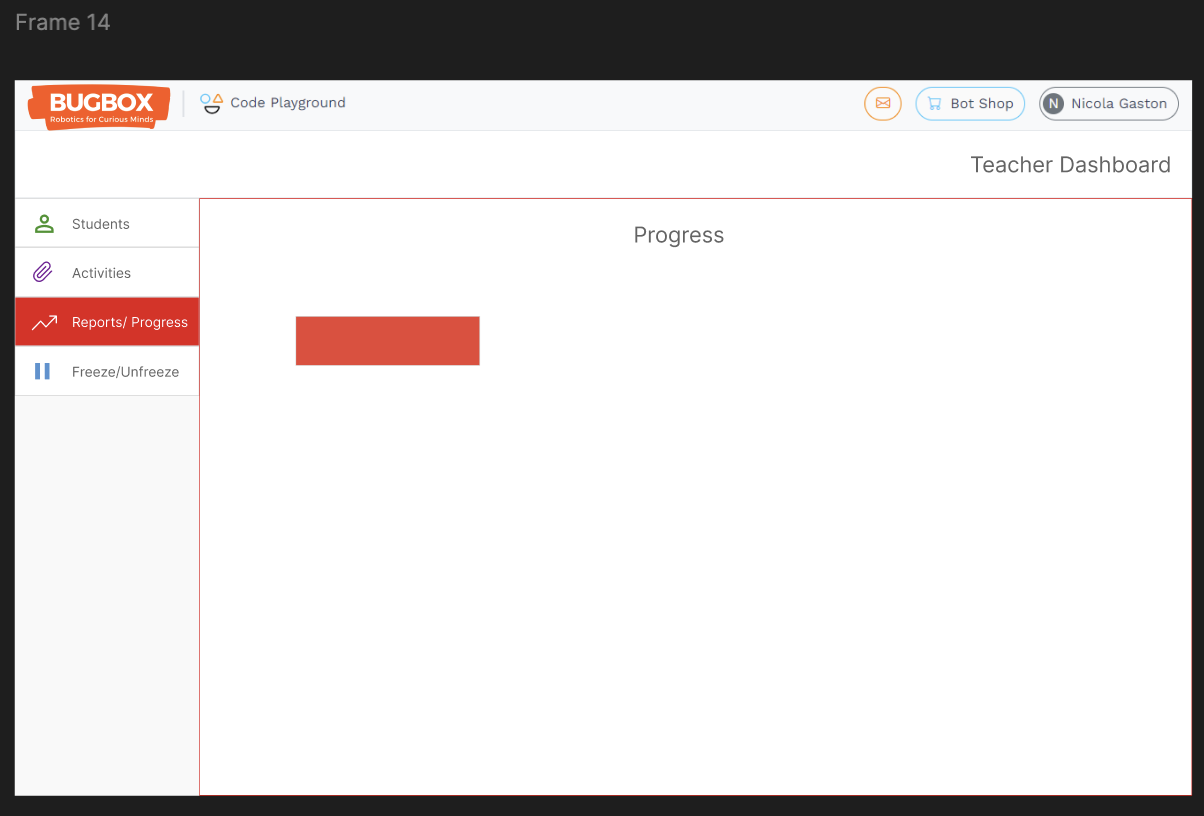
The Report Page offers detailed insights into a student's individual progress. Here, teachers can analyze performance metrics, identify strengths and weaknesses, and make informed decisions about future instruction. This tab serves as a vital resource for understanding each student's capabilities and areas needing improvement.
4: Freeze/Unfreeze Tab
The Freeze/Unfreeze Tab is a valuable tool for classroom management. If a teacher needs to pause students' activities to address the class, they can freeze the students' screens, allowing for focused instruction without distractions. Once the discussion is complete, teachers can easily unfreeze the screens, enabling students to resume their work.
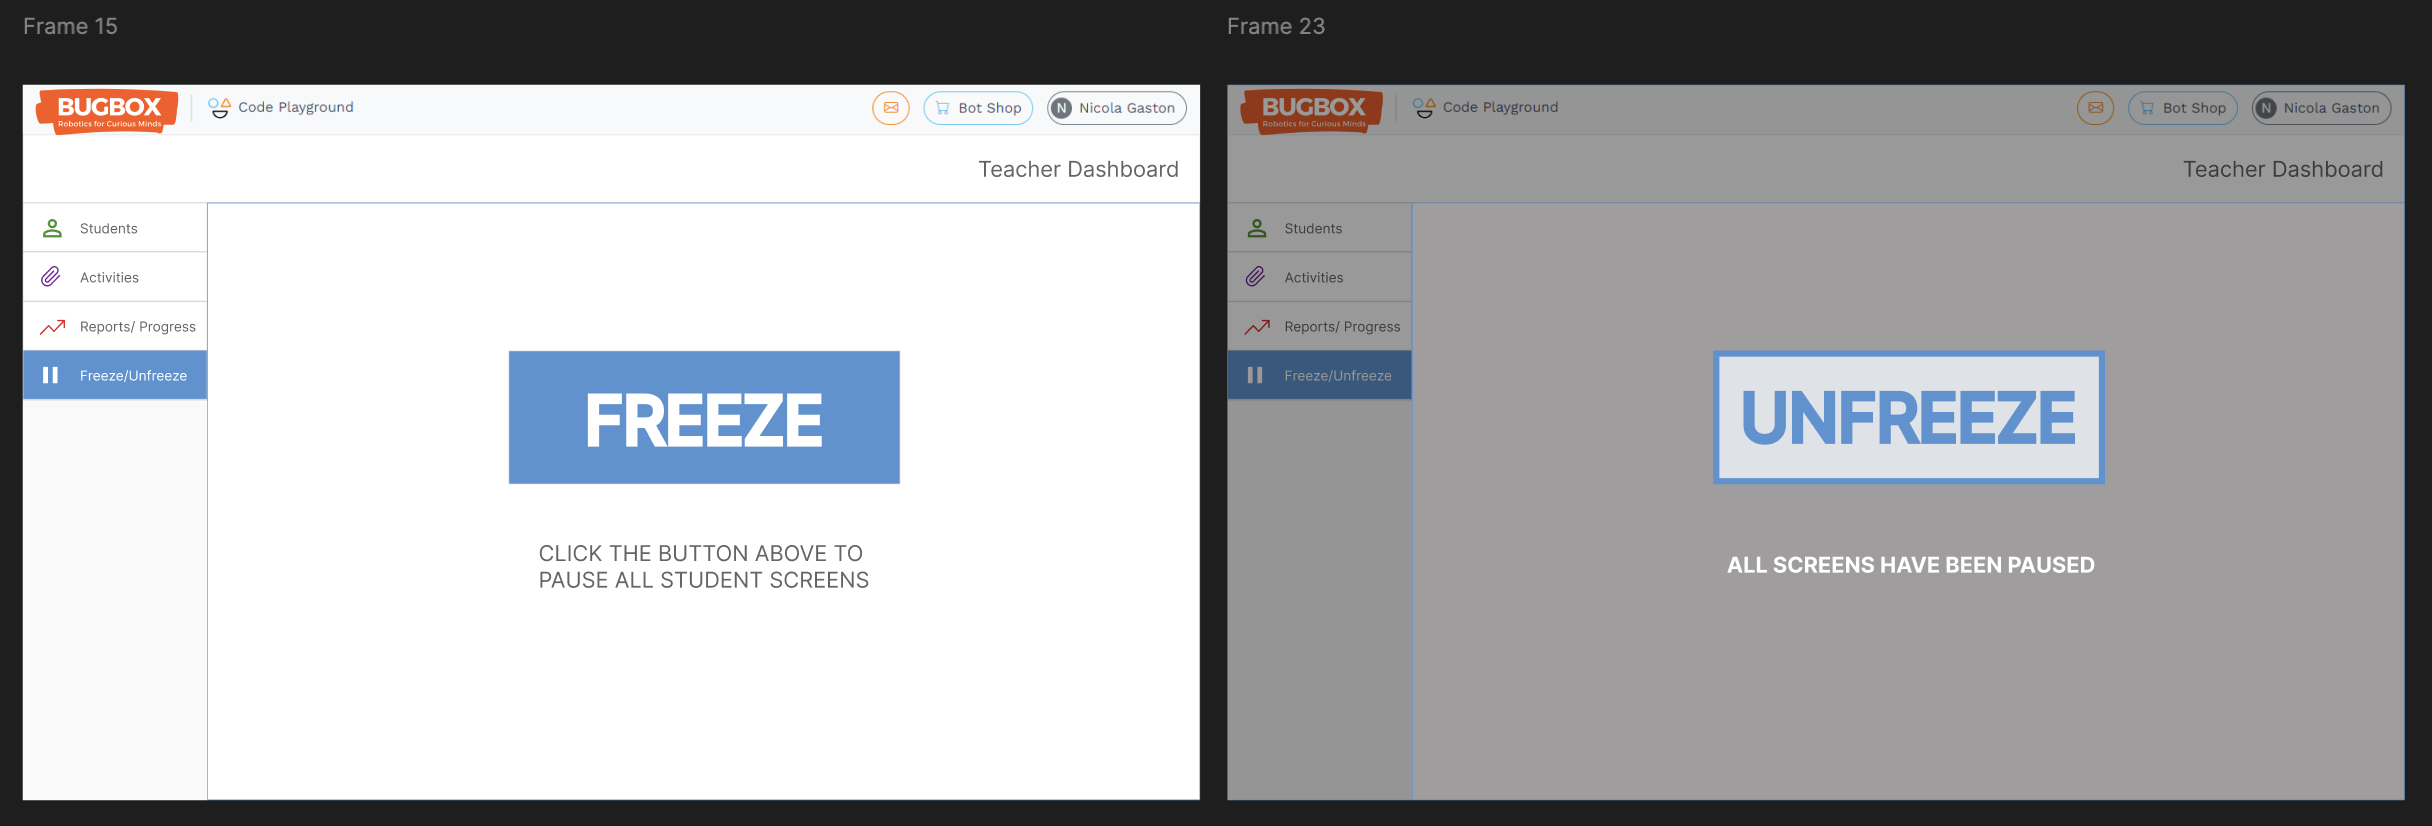
In addition to these functionalities, the dashboard enhances usability with visual feedback; hovering over the tabs on the left changes them to their respective colors, including the freeze and unfreeze buttons. This feature not only improves the aesthetic appeal but also provides clear, immediate feedback to the teacher, creating a user-friendly experience.

