Last updated by: brendankntb, Last updated on: 31/03/2024
Cycling Data Description
At this stage, this document only explores that data available in the “new Cyclist data.csv” file available from the T2 GitHub repository as we have not yet received Google Big Query access and therefore cannot yet explore the entire available dataset.
This document explores the cycling data available with the focus on how the data can be used for building predictive ML models.
Data Fields
The CSV file contains data related to cycling activities, structured as columns that capture different aspects of each cycling session. The fields contained within the dataset are:
-
Date_AEST: The date of the cycling activity, formatted as "DD-MMM-YY".
-
Time_first: A column with obscured or encrypted data.
-
Time_last: Another column with obscured or encrypted data.
-
Distance: Distance covered during the activity, presumably in kilometers.
-
calories: The number of calories burned.
-
Speed_max: The maximum speed achieved, likely in km/h.
-
Speed_min: The minimum speed, likely in km/h.
Note: All values in the dataset are set to 0. -
Speed_avg: The average speed, likely in km/h.
-
Heartrate_max: The maximum heart rate recorded.
Note: This is recorded to two decimal places for some entries which is very unusual for heart rate values but all such values and in .99 so it may be a transcoding issue rather than genuine extra precision. -
Heartrate_min: The minimum heart rate recorded.
Note: Similar to Heartrate_max, some entries are recorded to two decimal places with all such entries ending in .18. -
Heartrate_avg: Average heart rate.
-
Cadence_max: Maximum cadence, likely in revolutions per minute.
-
Cadence_min: Minimum cadence.
Note: All values in the dataset are set to 0. -
Cadence_avg: Average cadence.
-
Power_max: Maximum power output, likely in watts.
-
Power_min: Minimum power output.
Note: All values in the dataset are set to 0. -
Power_avg: Average power output.
-
FTP: Functional Threshold Power, a key cycling metric.
-
Time_Taken: Time taken for some aspect of the activity, format unclear.
-
dist_point in 20: A metric calculated to provide a score out of 20 from distance fields.
-
calories_point in 20: A metric calculated to provide a score out of 20 from calorie fields.
-
hertrate_point in20: A metric calculated to provide a score out of 20 from heart rate fields.
-
Speed_point iin 20: A metric calculated to provide a score out of 20 from speed fields.
-
power_points in 20: A metric calculated to provide a score out of 20 from power fields.
-
candence_point in 20: A metric calculated to provide a score out of 20 from cadence fields.
-
total_points: Total points from summing the six calculated points fields.
-
Duration: Duration of the activity in hours:minutes:seconds format.
-
Workout_duration: Duration of the workout, likely in hours.
Data features and characteristics
There are numerous unusual features of the dataset. The notable aspects are:
-
The Duration field contains nonsensical data. It appears to be in the format of hh:mm:ss but the values do not align with the distance and average speed fields for each record. Furthermore, all entries have 13:41 for the mm:ss portion of the field which is not realistically possible across 209 different cycling sessions. The hh portion increments by one for each record while resetting to 0 whenever the field exceeds 23. It is not known at this stage whether the problem is form the original data or was caused by an extraction error.
-
The Workout_duration is the hours portion of the Duration field which means that it is also nonsensical.
-
The Time_taken field does not align to the correct session duration either so it is not known what this field represents.
-
The various points fields are calculated from other fields but do not seem to add any value for building ML models. As yet, the actual calculation for creating each points field (other than the total) is not clear and has not been pursued because it is irrelevant.
Data manipulations
Since the Duration and Workout_duration fields were unreliable, a new field was created called Real_duration that was calculated from Distance / Speed_avg. This allowed a reliable duration field to be created.
Exploratory models
The python code and notebook related to this exploration is available at https://github.com/brendankntb/SPA_2023_T3/blob/main/Predictive Model Analysis.ipynb.
Exploratory models and visualisations were then created to test the ability to predict the Real_duration field from the other fields. Since this was envisaged as being used to predict how long a single ride might take, the Speed_avg field was removed because it would only be known after a ride was completed. For this initial exploration, the maximum speed was not removed because it was expected that the models would not find value in using that metric for predicting duration which was confirmed with the models created.
It is important to note that these models are not being optimised nor even expected to be the best possible models for predicting duration. They were simple and fast models being used to test whether the dataset contained information that looked reliable for predicting ride duration.
To that end, initially a simple random forest model was created for this testing.
Field correlations with Realduration
| Field | Correlation with Real_duration |
|---|---|
| Real_duration | 1.000 |
| Distance | 0.980 |
| Calories | 0.940 |
| Dist_point in 20 | 0.653 |
| Calories_point in 20 | 0.544 |
| Total_points | 0.543 |
| Cadence_max | 0.511 |
| Speed_max | 0.443 |
| Speed_point in 20 | 0.327 |
| Power_max | 0.292 |
| Cadence_avg | 0.242 |
| Speed_avg | 0.222 |
| Time_Taken | 0.192 |
| Power_points in 20 | 0.152 |
| Candence_point in 20 | 0.152 |
| Cadence_min | 0.109 |
| Power_avg | 0.043 |
| Heartrate_max | -0.098 |
| Workout_duration | -0.117 |
| Speed_min | -0.119 |
| Heartrate_min | -0.181 |
| Heartrate_avg | -0.206 |
| Hertrate_point in 20 | -0.224 |
| Power_min | - |
| FTP | - |
The initial view of correlations shows:
-
High Positive Correlation:
-
Distance (0.980): Strongly positive, indicating longer distances generally result in longer durations.
-
Calories (0.940): Also highly correlated, suggesting that more calories are burned in longer-duration activities.
-
-
Moderate Positive Correlation:
-
Dist_point in 20 (0.653) and Calories_point in 20 (0.544): These also correlate with Real_duration but it is significant that they correlate less strongly than the original fields that the were created from. This suggests that the points fields are not adding value to the predictive model.
-
Total_points (0.543): This also has a correlation lower than key fields above.
-
Cadence_max (0.511) and Speed_max (0.443): Higher maximum cadence and speed values are moderately associated with longer durations.
-
-
Low Positive Correlation:
-
Speed_avg (0.222): A low positive correlation suggests that higher average speeds don't necessarily correlate strongly with longer durations. This islikely due to varying intensity levels of the rides and the fact that longer rides may actually have lower average speed in some cases because of fatigue.
-
Cadence_avg (0.242), Power_max (0.292), and related metrics show low positive correlations, indicating a slight tendency for these metrics to be higher in longer rides. Once again, fatigue may impact on the correlation here and it is possible that there is a non-linear relationship that may increase up to a certain duration and then decrease after another duration.
-
-
Negative Correlation:
- Heartrate_max (-0.098), Heartrate_min (-0.181), and Heartrate_avg (-0.206): These negative correlations suggest that longer durations might require lower effort levels to be able to complete the entire workout.
Model performance
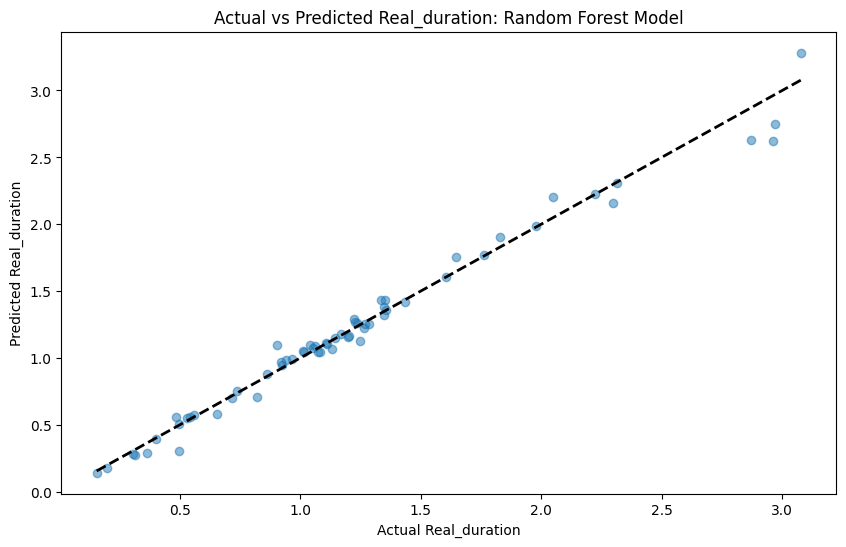
A random forest model was created to predict Real_duration after dropping the fields:
-
Real_duration
-
date_AEST
-
Time_first
-
Time_last
-
Duration
-
Time_Taken
-
Workout_duration
-
dist_point in 20
-
calories_point in 20
-
Speed_point iin 20
-
power_points in 20
-
candence_point in 20
-
total_points
The model achieved a mean squared error (MSE) of approximately 0.0069.