Last updated by: brendankntb, Last updated on: 31/03/2024
Cycling duration prediction models
A number of experiments were performed to test prediction models for duration of a workout based upon previous workout details. These experiments can been seen in the Python Notebook in the Project GitHub repository.
Data Loading and Preprocessing:
-
The notebook starts with loading cycling data that has been exported from Strava and that contains numerous attributes like distance, speed, heart rate, power, etc.
-
The data contains information for 181 Ride activities and 164 Run activities.
Feature Selection and Model Training:
-
A correlation analysis is done which shows that the highest correlations to Movint Time (duration) are:
Power Count 0.998145
Distance 0.982650 Total
Work 0.940714
Calories 0.787830
Maximum Power 2.0 hr 0.717964
Relative Effort 0.575082
Maximum Power 1.5 hr 0.568730
Dirt Distance 0.560717
Elevation Gain 0.504852 -
Many of these features are essentially proxies for distance as Work, Elevation Gain, Calories and others are going to increase as the duration of the workout increases.
-
Fields that are too closely related to Moving Time (duration) are removed before creating predictive models. These fields are Elapsed Time, Power Count, Moving Time and Average Elapsed Speed.
Model Evaluation:
-
Several different models are the created to test accuracy. These are:
-
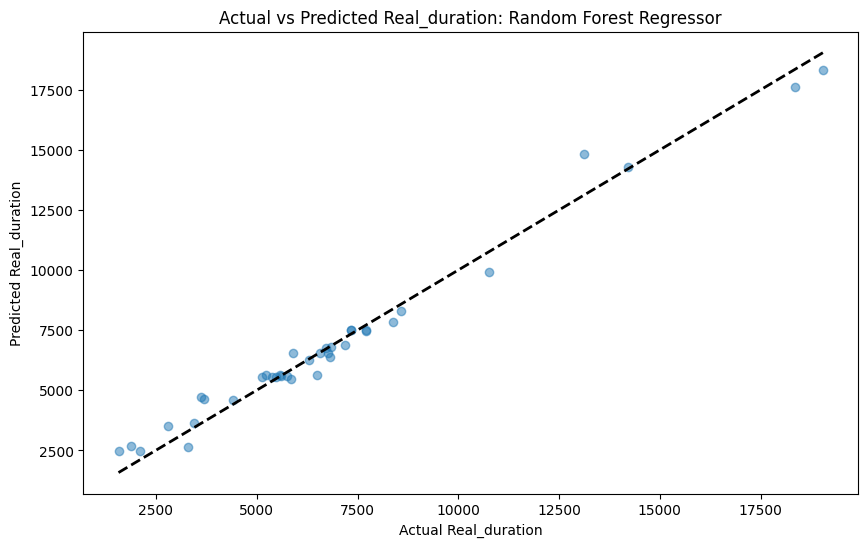
Random Forest Regressor
-
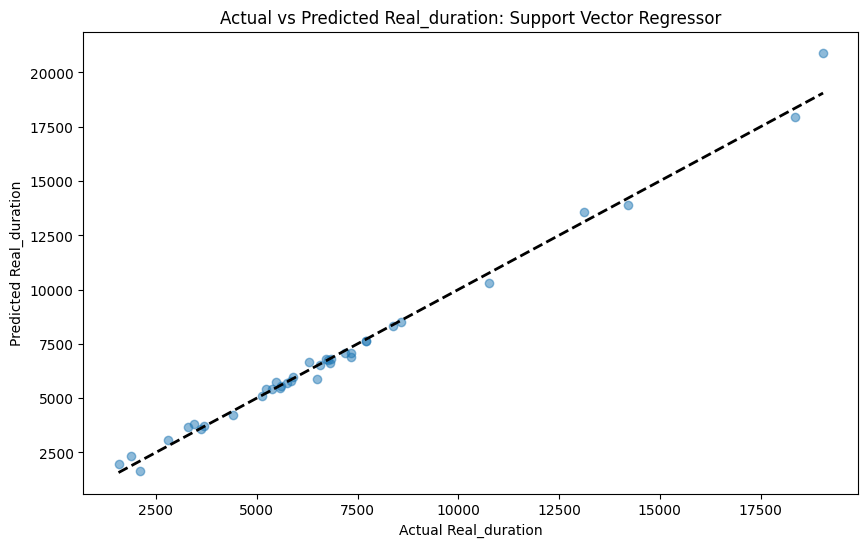
Support Vector Regressor
-
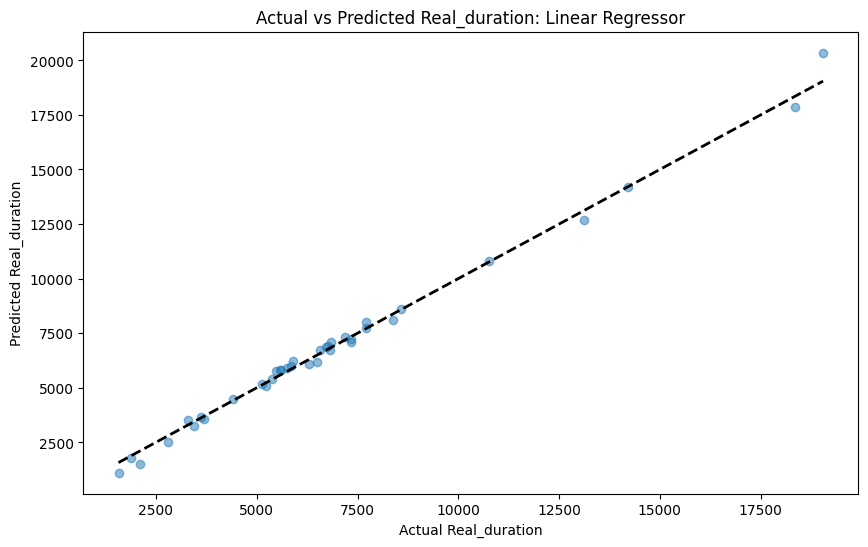
Linear Regressor
-
Neural Network
-
-
Mean squared error is the primary metric used to quantify the model's performance.
-
Each model is used to plot actual versus predicted durations to visualise model performance.
-
The available data was split 80/20 for training/testing.
-
GridSearchCV is used to optimise hyper parameters for Random Forrest Regressor and Support Vector Regressor.
-
Multiple NN architectures and numbers of epochs were tested.
Visualisation and Performance:
-
The visualisations of each model are:

-
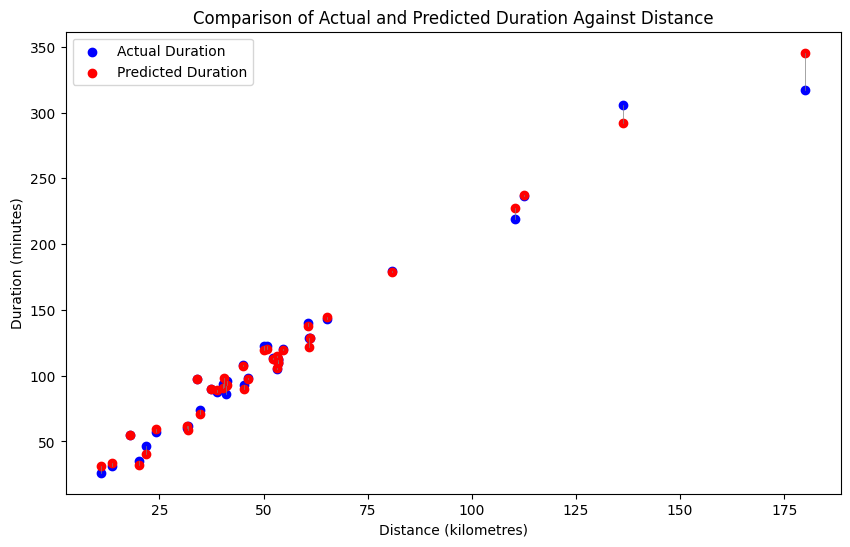
A scatter plot was also produced of the Actual versus Predicted durations with the values connected to show how close each prediction was.
-
These Mean Squared Error for each model is.
| Model | RMSE | Time |
|---|---|---|
| Random Forest Regressor | 566.94 | 8.1s |
| Support Vector Regressor | 409.94 | 0.2s |
| Linear Regressor | 321.32 | 0.1s |
| Neural Network | 361.08 | 11.8s |
- Across the 37 test cases, the average difference between the predicted duration and the real duration was 14.3s for rides averaging 1:53:58.
Conclusions:
-
The Neural Network model performed quite well when tuned but the Linear Regressor still produced a smaller RMSE.
-
The Linear Regressor was also the fastest model.
-
It was concluded that a simple Linear Regression model could accurately predict workout duration and required the least resources to do so.